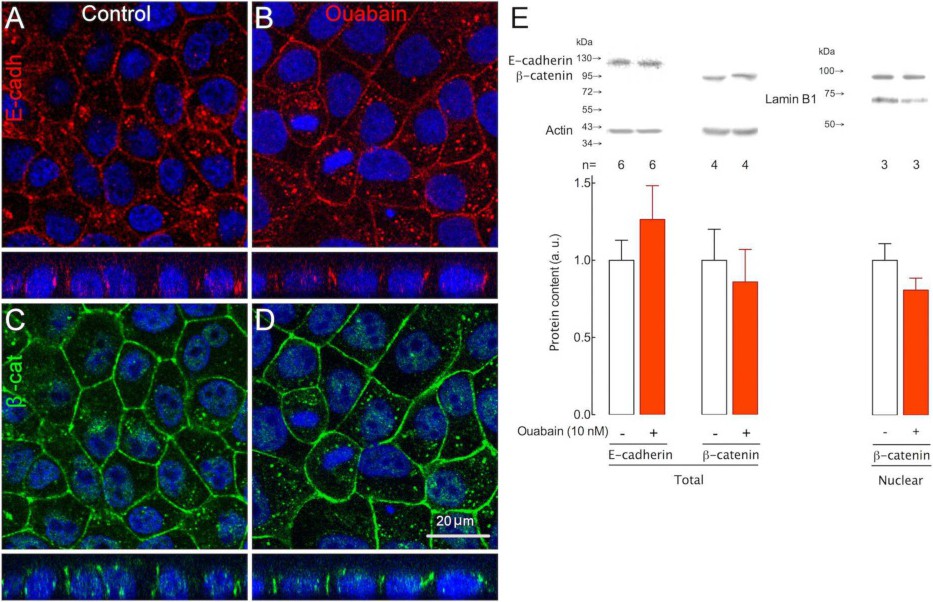
Fig. 2. Na+,K+-ATPase acts as an ouabain receptor for adherens junction regulation. Fluorescence images corresponding to single optical slices. Immunofluorescence of E-cadherin (E-cadh, A and B, red) or β-catenin (β-cat, C and D, green) in confluent monolayers of control MDCK cells (A and C) and MDCK cells incubated for 8 h in 10 nM ouabain (B and D). Nuclei are stained in blue. Cell monolayers are observed in fluorescence images of single optical slices in the x-y (upper) and x-z (lower) orientations. R-MDCK cells express a mutant Na+,K+-ATPase with low affinity for ouabain. Western blotting (E, above) and densitometric analysis (E, graph) of cellular or nuclear protein extracts normalized to actin or lamin B1 (E, above), respectively, showing the protein content of control (white bars) and ouabain treated (red bars) cell monolayers. n= 6-3, analyzed with t-test of ouabain vs. control.